
By Sudeep Bath
| August 14, 2026
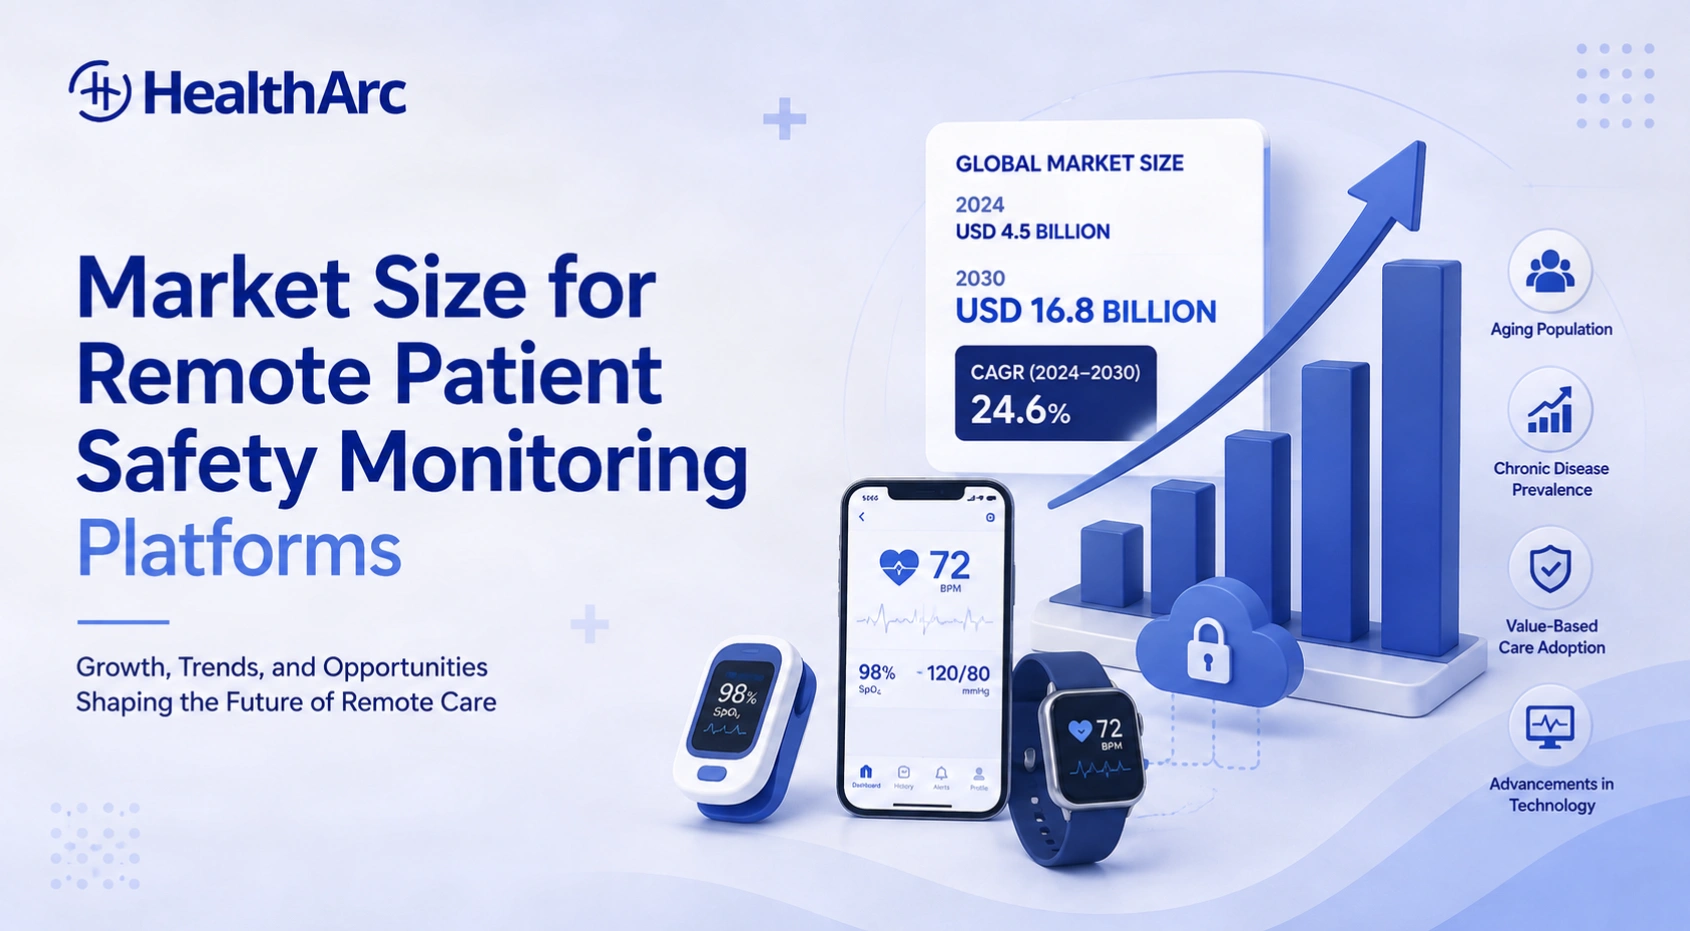
If you’ve gone looking for the market size for remote patient safety monitoring platforms, you already know the problem. One report says the market is worth $212 million. Another says $290 billion. Both are current, both are from firms that sell research for real money, and they’re roughly three orders of magnitude apart.
Neither one is lying. They’re measuring different things, and almost nobody says which thing out loud.
So here’s what this post does. It lays out what every major published estimate actually covers, separates the two distinct markets that get jammed together under this phrase, checks the top-down forecasts against what Medicare genuinely paid out in claims, and gives you a method for producing a number you can defend in a board deck or an investment memo. If you need a figure for a specific purpose, the last section is the one you want.
Key Takeaways
- There is no single market called “remote patient safety monitoring platforms.” The phrase spans ambulatory remote patient monitoring and inpatient patient safety monitoring, which are different buyers, different budgets, and different revenue models.
- Published global figures for 2025 and 2026 run from $211.8 million (fall management) to $289.77 billion (RPM devices by 2034). The spread comes from scope, not disagreement about growth.
- Two firms sizing what they both call the RPM systems market put 2025 at $26.0 billion and $8.68 billion. Same year, same label, three times apart.
- The US RPM market clusters much more tightly, at roughly $16 billion to $19 billion for 2025 and 2026 across three independent firms, at CAGRs of 12% to 16%.
- Medicare fee-for-service actually paid $536 million for RPM in 2024 across about 1 million enrollees, per HHS OIG. That’s the hard floor under every top-down estimate, and the gap between it and “$17 billion” is the number you need to understand.
- The inpatient safety side is smaller and far less well sized, but its economics are the clearest: falls were 49% of all Joint Commission sentinel events in 2024, and Medicare has refused to pay the higher DRG for in-hospital fall injuries since October 2008.
Table of Contents
The Phrase Covers Two Different Markets
This is the distinction that resolves most of the confusion, and it’s worth getting straight before you look at a single dollar figure.
Ambulatory remote patient monitoring. A patient at home with a connected blood pressure cuff, weight scale, or glucose meter. Data flows to a clinical team that reviews it and bills Medicare or a commercial payer monthly. The buyer is a physician practice, health system, or FQHC. The revenue model is reimbursement, which means CMS sets the ceiling. This is what remote patient monitoring means in nearly every published report, and it’s where the large numbers live.
Inpatient patient safety monitoring. Continuous video observation of hospitalized patients at risk of falling, pulling out a line, wandering, or self-harm. One remote technician watches ten to sixteen rooms and calls the floor when something happens. Vendors here include AvaSure, Caregility, CareView, Artisight, and Teladoc Health. The buyer is a hospital nursing or quality department. The revenue model is a per-bed or per-monitored-room subscription, and there is no billing code for it, so the purchase is justified by avoided cost rather than new revenue.
“Remote patient safety monitoring platform” describes the second one more accurately. Almost every search result you’ll get is sizing the first one. That mismatch is why the numbers feel incoherent.
A third category overlaps both: consumer and senior-living fall detection, the pendants and radar sensors sold into assisted living and to families directly. Some reports fold it into patient safety, others treat it as consumer electronics.
What Every Published Estimate Actually Says
Here is the full picture in one table, with the scope each firm is actually measuring. Read the middle column before the numbers.
| Source | What it measures | Value | CAGR |
|---|---|---|---|
| Fortune Business Insights | RPM devices + services, global | $59.92B (2025) → $289.77B (2034) | 19.16% |
| Grand View Research | RPM software + services, global | $8.5B (2023) → $65.0B (2030) | 34.9% |
| Grand View Research | RPM systems, global | $26.0B (2025) → $110.7B (2033) | 20.0% |
| Precedence Research | RPM systems, global | $8.68B (2025) → $38.74B (2034) | 18.0% |
| Market Data Forecast | RPM, United States | $17.02B (2025) → $19.14B (2026) | 12.48% |
| MarketsandMarkets | RPM, United States | $16.09B (2025) | 12.6% |
| Coherent Market Insights | RPM, United States | $17.2B (2026) | 16.3% |
| Straits Research | Patient safety & risk management software, global | $2.44B (2025) → $6.0B (2034) | 10.5% |
| Coherent Market Insights | Fall detection systems, global | $8.38B (2026) → $15.75B (2033) | 9.4% |
| Research and Markets | AI-driven virtual nursing assistants, global | $1.76B (2025) → $4.19B (2029) | 24.2% |
| IMARC Group | Fall management, global | $211.8M (2025) → $308.3M (2034) | 4.13% |
Now the spread makes sense. The $290 billion figure counts every connected medical device and the services wrapped around them, worldwide, nine years out. The $212 million figure counts a narrow slice of fall-management product revenue. They aren’t competing estimates of the same quantity. They’re answers to two unrelated questions.
One pattern worth noticing: the CAGRs sort cleanly by how software-heavy the segment is. Device and product categories grow at 4% to 10%. Software, services, and AI categories grow at 18% to 35%. Whatever else you believe about these forecasts, every firm agrees the software layer is where the growth sits.
Why Two Firms Can Be 3x Apart on the Same Market
Look at rows three and four again. Grand View Research puts the global RPM systems market at $26.0 billion in 2025. Precedence Research puts it at $8.68 billion the same year. Same nominal category, same base year, a factor of three between them.
Four things generate that kind of gap.
Device revenue counted or excluded. A blood pressure cuff sold into an RPM program can be counted at hardware retail value, at the reimbursed device supply rate, or not at all if the report is software-only. Devices dominate the total, so this choice alone can triple a number.
Where the platform ends. Some firms count only the monitoring platform license. Others include the clinical staffing services, patient onboarding, logistics, and shipping that vendors bundle. Services are typically the majority of contract value. Fortune Business Insights explicitly projects services at 64.18% of its 2026 total.
Adjacent categories pulled in. Cardiac implantables, continuous glucose monitors, and connected pulse oximeters are all arguably remote monitoring. CGM alone is a multi-billion-dollar market. Include it and your number jumps; exclude it and you look conservative next to competitors.
Vendor revenue versus healthcare spend. A report can size what vendors bill, or what the health system spends including internal staff time. These differ by a lot, and the distinction is rarely stated on the page you can read for free.
The practical consequence: any figure you cite is meaningless without its scope attached. “The RPM market is $26 billion” is not a fact. “Grand View Research sized global RPM systems at $26.0 billion in 2025, including devices” is.
The US Market Is the Tighter Number
Here’s something encouraging. When you narrow to the United States, the estimates converge sharply:
- Market Data Forecast: $17.02 billion in 2025, $19.14 billion in 2026, 12.48% CAGR
- MarketsandMarkets: $16.09 billion in 2025, 12.6% CAGR
- Coherent Market Insights: $17.2 billion in 2026, 16.3% CAGR
Three independent firms landing inside a $1 billion band on a $17 billion market is about as much agreement as this industry produces. The US is easier to size because reimbursement is documented, CMS publishes claims data, and the provider universe is countable.
North America’s share of the global market runs between 40% and 51% depending on the report. Grand View Research put North America at 51.2% of RPM software and services in 2023 and 40.4% of RPM systems more recently. Fortune Business Insights has North America at 48.06% in 2025, with the US at $30.7 billion of its $34.31 billion North America figure for 2026. Note that the last number is on Fortune’s device-inclusive basis, which is why it’s roughly 1.7 times the other US estimates. Same country, different scope, exactly as the pattern predicts.
If you need one defensible sentence for a US deck: the US remote patient monitoring market is roughly $16 to $19 billion in 2026, growing at 12% to 16% annually, and you should say which report you took it from.
What Medicare Actually Paid, and Why It Matters
This is the section that separates a defensible model from a repeated statistic, and it’s the part no market-research page will give you.
In 2025, HHS Office of Inspector General published a data snapshot on Medicare RPM billing. It contains actual paid claims, not projections. The OIG found that Medicare paid $536 million for remote patient monitoring in 2024, a 31% increase over 2023. About 1 million Medicare enrollees received RPM that year, up 27%. Roughly 4,639 practices billed for it routinely.
Run the arithmetic. $536 million across 1 million enrollees is about $536 per enrollee for the year, or roughly $45 a month. That lines up with what the monthly RPM management and device supply codes actually pay, which is a useful sign the two figures are consistent.
Now hold that against “the US RPM market is $17 billion.” Medicare fee-for-service, the single largest and most RPM-friendly payer in the country, spent about half a billion dollars. The published market figure is roughly thirty times larger.
That gap is not an error, and understanding it is the whole point:
- Devices. Hardware revenue is counted at product value in most reports and dwarfs the professional fees.
- Other payers. Medicare Advantage now covers more than half of Medicare beneficiaries, and its spending doesn’t appear in fee-for-service claims. Commercial plans, Medicaid, and the VA add more.
- Inpatient and enterprise spend. Hospital monitoring infrastructure, virtual nursing programs, and command centers are capital and operating budgets, not billed claims.
- Vendor services. Platform licenses, staffing, and logistics get counted as market revenue even when no claim is ever submitted.
- Outside the US. Global figures include markets with no equivalent to CPT-based RPM reimbursement.
So use the OIG figure as your floor. US Medicare fee-for-service RPM is a roughly $536 million market growing above 30% a year, and that portion is verified with claims rather than modeled. Anything above it is real, but it depends on assumptions you should be able to name. If your model needs the $17 billion number to work, you should be able to say which of the five buckets above is carrying the weight.
For anyone modeling program economics rather than market size, our guide to RPM pricing models works the same numbers from the provider’s side, and the revenue calculator runs per-patient math against current rates.
Sizing the Inpatient Safety Monitoring Side
If what you actually want is the market for hospital patient safety monitoring platforms, the honest answer is that no one publishes a clean, credible figure for it. The category is young, the vendors are mostly private, and it gets absorbed into larger buckets. What you can do is bracket it with the adjacent markets that do get sized:
| Proxy market | 2025–2026 value | CAGR | What it tells you |
|---|---|---|---|
| Patient safety & risk management software | $2.44B (2025) | 10.5% | Upper bracket; includes incident reporting and compliance software, not just monitoring |
| Fall detection systems | $8.38B (2026) | 9.4% | Mostly consumer and senior-living hardware, not hospital platforms |
| AI-driven virtual nursing assistants | $1.76B (2025) | 24.2% | Closest software analogue; growth rate is the signal |
| Fall management | $211.8M (2025) | 4.13% | Narrowest slice; a floor, and clearly not the whole opportunity |
Reading those together, the inpatient safety monitoring platform market is plausibly in the low single-digit billions globally, growing in the high teens to mid twenties, with the growth concentrated in software and AI rather than hardware. That is a range with reasoning attached, which is more useful than a false point estimate.
Two demand-side data points support the direction. A hospital-leader survey found 74% believe virtual nursing is or will soon be a core part of inpatient care, up from 66% the year before. And consolidation has started: AvaSure acquired Nurse Disrupted in March 2025.
One caution about the ROI figures you’ll encounter. Vendor materials commonly cite reductions in falls of up to 49% and annual savings up to $4.7 million per organization. Those are vendor-published, drawn from selected customer sites, and not peer-reviewed. Treat them as marketing claims until you see the methodology. Directionally the savings are real; the specific percentages are not something to underwrite a forecast with.
The Economics That Make the Safety Segment Real
The inpatient safety market may be poorly sized, but its demand driver is documented better than almost anything in health tech. Hospitals pay for this because falls are expensive and unreimbursed.
Falls are the most reported sentinel event in American hospitals, and it isn’t close. The Joint Commission’s 2024 annual review logged 776 voluntarily reported patient falls, about 49% of all sentinel events that year. Of those, 51 patients died, 503 suffered severe harm, and 199 moderate harm. Head and brain injuries led at 38%, followed by hip fractures at 25%. Falls have topped this list every year since 2021.
The mechanisms are specific enough to design against. Walking accounted for 31% of falls, falling from bed 30%, and falling from the toilet 18%. Patients 70 and older made up 56%. A continuous video monitor watching bed exits and bathroom transits is aimed directly at where the events happen, which is why this technology gets bought at all.
The volume is large. AHRQ estimates 700,000 to 1,000,000 people fall in a US healthcare setting each year. Among older adults, fall-related emergency department and inpatient visits cost about $22.9 billion annually, with inpatient visits averaging roughly $18,000 each. An injurious inpatient fall adds six to seven hospital days and about $14,000 in treatment cost.
And the hospital eats it. This is the part that turns a safety problem into a purchasing decision. Section 5001(c) of the Deficit Reduction Act of 2005 directed CMS to identify preventable hospital-acquired conditions, and falls and trauma made the list. For discharges on or after October 1, 2008, when a fall injury is the only thing that would have moved a case into a higher-paying DRG, CMS pays as if the fall never happened. The Hospital-Acquired Condition Reduction Program, established by Section 3008 of the Affordable Care Act, then reports falls and trauma publicly, and CMS does not risk-adjust the measure for case mix, because it treats these as events that shouldn’t occur regardless of how sick the patient is.
Put plainly: an in-hospital fall generates cost the hospital cannot bill for, plus a public quality penalty. A monitoring subscription that prevents a handful of them a year pays for itself. That’s a durable buying rationale, and it doesn’t depend on a CPT code existing.
What Could Shrink the Forecasts
Every report in the table above projects growth. Most of them are directionally right. But the ambulatory RPM forecasts carry a specific risk that the published CAGRs don’t price in, and if you’re using these numbers for a real decision you should know about it.
CMS reimbursement sets the ceiling on the US RPM market, and CMS is tightening. The CY2027 Medicare Physician Fee Schedule proposed rule would pay for RPM treatment management only when a practice’s own employed clinical staff perform it, require a separately billable initiating visit before monitoring starts, and revalue the device supply codes downward. Our breakdown of the CY2027 proposed rule and RPM covers the detail.
Any of those three would slow the growth these forecasts assume. The employed-staff provision in particular would invalidate the business model of a large share of the RPM vendor market, where the vendor supplies the nurses and the practice bills for their time. A 34.9% CAGR built on the 2020 through 2024 reimbursement environment is not obviously the right rate for 2027 through 2030.
The safety monitoring segment is more insulated, since it was never reimbursement-dependent. Its risk is different: hospital capital budgets and the possibility that nurse staffing pressure eases.
Neither of these makes the market smaller today. They’re reasons to treat a nine-year CAGR as a scenario rather than a projection.
How to Build a Number You Can Defend
If you need a figure for a board deck, an investment memo, or a business case, here’s the sequence that survives scrutiny.
1. Say which market you mean. Ambulatory RPM, inpatient safety monitoring, or consumer fall detection. Write it in the sentence. Most arguments about market size are actually two people sizing different things.
2. Pick geography before scope. If your business is US-only, use the US figures. The $16 to $19 billion range across three firms is defensible; a global number divided by a guessed regional share is not.
3. State whether devices are in or out. This single choice moves the number more than anything else. If you sell software, exclude hardware and say so. Your market gets smaller and your credibility goes up.
4. Anchor to something countable. For ambulatory, that’s reimbursement: eligible patients, realistic enrollment rate, current per-patient-per-month rate. For inpatient, it’s beds: US staffed beds, plausible monitored-bed penetration, per-bed subscription price. A bottom-up number built from units and prices beats a top-down number you can’t decompose.
5. Sanity-check against paid claims. The OIG’s $536 million is the only figure in this entire post derived from actual money that changed hands. If your bottom-up model implies a US Medicare RPM market of $5 billion today, it’s wrong, and you just caught it before someone else did.
6. Publish the range and name your sources. “$16 to 19 billion for US RPM in 2026 per Market Data Forecast, MarketsandMarkets, and Coherent, excluding inpatient safety monitoring, which we size separately at low single-digit billions globally” is a sentence nobody can pick apart. A single confident number with no attribution is a sentence anybody can.
We go through this exercise with health systems and investors evaluating RPM and chronic care management programs regularly, and the failure mode is almost always the same. Someone brings a $65 billion TAM to a decision that hinges on how many of their own patients will enroll and what Medicare pays per month. The big number is not the useful one.
Frequently Asked Questions
What is the market size for remote patient safety monitoring platforms?
It depends entirely on which market you mean. Ambulatory remote patient monitoring is sized between $8.68 billion and $59.92 billion globally for 2025, and $16 to $19 billion for the United States. Inpatient patient safety monitoring platforms, the virtual sitter and continuous observation category, have no clean published figure, but adjacent markets place them in the low single-digit billions globally. Published estimates across all related categories span $211.8 million to $289.77 billion.
How big is the remote patient monitoring market?
For 2025 and 2026, global estimates range from $8.68 billion (Precedence Research, RPM systems) to $59.92 billion (Fortune Business Insights, RPM devices and services). The difference is whether device hardware and bundled services are counted. CAGRs cluster between 18% and 35%.
How big is the US remote patient monitoring market?
Roughly $16 billion to $19 billion for 2025 and 2026. Market Data Forecast puts it at $17.02 billion in 2025 and $19.14 billion in 2026; MarketsandMarkets at $16.09 billion in 2025; Coherent Market Insights at $17.2 billion in 2026. Growth estimates run 12.48% to 16.3%.
Why do remote patient monitoring market size estimates vary so much?
Four reasons: whether device hardware is counted, whether bundled clinical services and logistics are included, whether adjacent categories like continuous glucose monitoring and cardiac implantables are folded in, and whether the figure measures vendor revenue or total healthcare spend. Two firms sizing what they both call RPM systems put 2025 at $26.0 billion and $8.68 billion.
How much did Medicare actually pay for remote patient monitoring?
$536 million in 2024, according to an HHS Office of Inspector General data snapshot, a 31% increase over 2023. About 1 million Medicare enrollees received RPM services, up 27%, and 4,639 practices billed for it routinely. That works out to about $45 per enrollee per month.
Is remote patient safety monitoring the same as remote patient monitoring?
No. Remote patient monitoring generally means home-based monitoring of chronic conditions, billed to Medicare or a commercial payer. Remote patient safety monitoring usually means continuous video observation of hospitalized patients at risk of falls or self-harm, sold as a per-bed subscription with no billing code attached. Different buyers, different budgets, different economics.
What is the fastest growing segment?
Software and AI. Device and product categories in this space grow at 4% to 10% annually, while software, services, and AI-driven categories grow at 18% to 35%. Fortune Business Insights projects services at 64.18% of its 2026 RPM total.
Which region leads the market?
North America, at between 40% and 51% of global revenue depending on the report and the scope. Grand View Research put North America at 51.2% of RPM software and services in 2023; Fortune Business Insights has it at 48.06% in 2025, with the US alone at $30.7 billion for 2026 on a device-inclusive basis.
Why do hospitals buy patient safety monitoring if there is no reimbursement for it?
Because falls cost them money they cannot bill. Since October 1, 2008, CMS has not paid the higher DRG weight that an in-hospital fall injury would otherwise generate, under the Deficit Reduction Act hospital-acquired condition provision. Falls and trauma are also publicly reported under the HAC Reduction Program without risk adjustment. An injurious fall adds six to seven hospital days and roughly $14,000 in cost, all of it unreimbursed.
How common are hospital falls?
AHRQ estimates 700,000 to 1,000,000 people fall in a US healthcare setting annually. The Joint Commission logged 776 patient falls as sentinel events in 2024, about 49% of all reported sentinel events, including 51 deaths and 503 cases of severe harm. Falls have been the most reported sentinel event every year since 2021.
Who are the main vendors in remote patient safety monitoring?
On the inpatient safety and virtual nursing side: AvaSure, Caregility, CareView Communications, Artisight, Teladoc Health, Equum Medical, and Vitalchat, among others. On the ambulatory RPM device side: Philips, Medtronic, GE HealthCare, Boston Scientific, Omron, and VitalConnect. Most inpatient safety vendors are private, which is part of why the segment is hard to size.
Are these market forecasts reliable?
Treat them as scenarios. The US RPM figures are the most trustworthy because reimbursement is documented and claims data is public. Long-dated global CAGRs are built on a 2020 to 2024 reimbursement environment that CMS is now tightening. The CY2027 proposed rule would restrict who can perform billable RPM work and lower device payment rates, which would slow the growth these forecasts assume.
What is the best single number to cite?
For the US ambulatory market: $16 to $19 billion for 2026, growing 12% to 16%, naming the firm you took it from. For the verified floor: $536 million in Medicare fee-for-service RPM payments in 2024, from OIG claims data. Avoid citing a global figure without stating whether devices are included.
Figures in this post come from published summaries by Fortune Business Insights, Grand View Research, Precedence Research, Market Data Forecast, MarketsandMarkets, Coherent Market Insights, Straits Research, IMARC Group, and Research and Markets, current as of August 2026; from the HHS OIG data snapshot on Medicare RPM billing; from The Joint Commission’s 2024 sentinel event annual review; and from AHRQ and CMS. Market research figures are vendor estimates, not audited data, and firms revise them between editions. Verify the current edition and its stated scope before using any figure in a transaction.
The Short Version
There is no single market size for remote patient safety monitoring platforms, because the phrase covers two markets that share almost nothing but a name. Ambulatory RPM in the US is a $16 to $19 billion market growing 12% to 16%. Inpatient safety monitoring is plausibly low single-digit billions globally, growing faster, and genuinely under-measured. Medicare fee-for-service paid $536 million for RPM in 2024, and that is the only number here backed by claims rather than a model.
Pick your definition, pick your geography, say whether devices are in, and check your bottom-up math against what Medicare actually paid. Do that and your number will hold up in the room.
Building a business case for a remote monitoring or care management program? Book a HealthArc demo and we’ll model it bottom-up from your own patient panel and current reimbursement rates, instead of from someone else’s TAM slide.


Ready to connect care between visits?
See how HealthArc runs RPM, CCM and seven more CMS programs — the platform, the devices and the clinical team — on a single demo.